
This post features some early findings from my study on Hive NYC’s minigroup, an online listserv where members seek advice and share ideas, accomplishments, and opportunities. My final study will also include a qualitative and quantitative analysis of the content of minigroup posts, with attention to the network goals of sparking organizational innovation and supporting youth interest-driven learning trajectories. Here I will speak to trends in minigroup posting activity (rather than the content of the posts) based on posting metadata, including how active the minigroup is, who belongs to the minigroup, how members’ connections to the Hive relate to their posting patterns, and how minigroup activity has changed over time.
My Process
As a senior in high school, this has been my first time doing real, on-the-ground (in a manner of speaking) research. Since I posted about the launch of my study, I have learned quite a bit about how to ask and answer relevant research questions with efficiency and accuracy.
My research approach is two-pronged: I am using qualitative codes to explore the practices that minigroup users engage in through their posts, which include circulating opportunities, asking for information, and sharing successes. And I’m using meta-data information like organization size and join date to give context and find quantitative patterns. Dedoose, a research analysis tool, lets me organize and compare these qualitative and quantitative data.
I was surprised to discover the detailed planning involved in finding the basic descriptive data I focus on in this post. I needed to figure out the organizational affiliation for each poster as well as the characteristics, including size and when they joined the Hive, for each organization. Since this info doesn’t actually live in one place (until now!), I used LinkedIn, went through every organization’s website, and reached out to many Hive members – all of whom were very helpful – to compile and triangulate as much of this information as possible and ensure an accurate analysis.
Once I had my data, I had to figure out how to put it in an analyzable form. With guidance from Rafi, an HRL Project Lead, I created multiple research models in dedoose using small samples of data in order to figure out which approach would allow me to answer the questions I have. This saved me many hours and I only got a workable model on around my fifteenth try. I also learned that because many aspects of my data build on each other, it saves quite a bit of time to be precise and check my work.
At the culmination of months of experimenting, counting, checking, and rechecking, I began to find meaning in the numbers. It was exciting to transition from seeing a detailed, sectional view of each data set to examining the broader picture of minigroup activity and how it relates to Hive goals. Below is a summary of my initial findings with embedded big-picture analysis.
General Activity
First, I found some general statistics on who belongs to the Hive NYC minigroup, who posts to minigroup, and how frequently they do so.
Who are minigroup members?
364 people belong to Hive NYC minigroup. 77% (n=281) of minigroup members are “officially” Hive NYC-affiliated, and 23% (n=83) are non-affiliated.1 In reviewing who is included in this group of non-members, I found that it was split among people from youth-oriented nonprofit organizations that are not Hive members, teachers and NYCDOE affiliates, and people with research interests relating to the Hive.²
Who is posting to minigroup?
Of the 364 minigroup members, 56% (n=205) posted to minigroup in the time frame of my data sample, October 26, 2011 – September 4, 2013. This means that a substantial proportion of minigroup members “lurk” without posting, which is not uncommon in online listservs. In fact, compared to other online listservs, minigroup sees a higher ratio of lurkers to posters. According to the 1% Rule, which is comprised of numbers from sites including YouTube, Wikipedia, and Yahoo Groups, only a small number of people (around 1-10%) actually post to participatory online communities – most people just “lurk” and absorb information. While it is important to note that these sites are public and minigroup is a closed community, compared to the vast majority, it is a particularly active online space.
Of the people that do post to minigroup, 90% (n=184) are Hive NYC affiliates and 10% (n=21) are not. While Hive affiliates are responsible for the majority of minigroup posts, non-affiliates are healthy contributors as well. This participation beyond just those that are “technically” Hive-affiliated fits with the Hive’s values of being an expansive community that welcomes voices beyond just members and wants to be exposed to outside ideas.
To date, all Hive NYC member organizations have posted to minigroup, which suggests healthy participation from the core Hive community. Still, it is important to note that a member only needed to post one time to be counted as a posting organization. Further investigation in this post and later on will reveal a more fine-grained picture of member organizations’ participation patterns.
How often are people posting to minigroup?
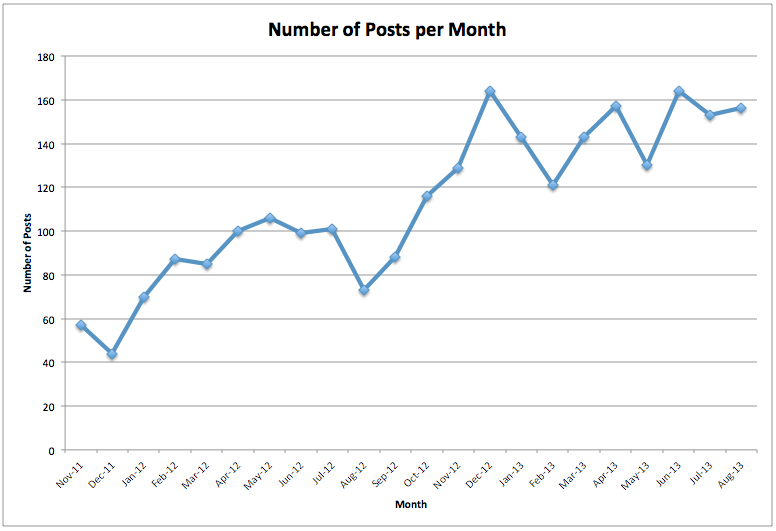
As of early September 2013, there had been 2492 posts to minigroup. 36.7% (n=914) are initial posts and 63.3% (n=1578) are comments. Minigroup activity has also seen a generally steady increase since its launch in late October of 2011, with some dips in activity. Summer dips, such as in August 2012, may be attributed to people going on vacation at the end of the summer. Other dips, such as in February 2013, are less easily explained.
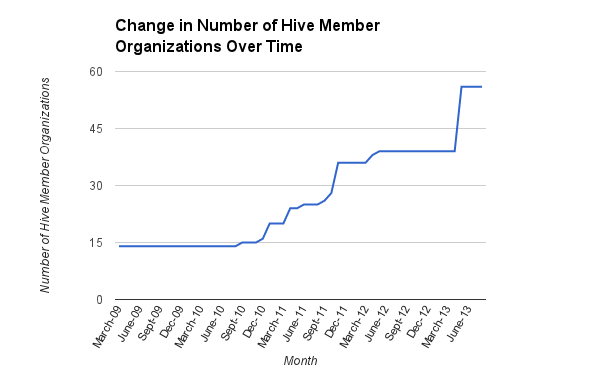
Still, it is important to note that the Hive has significantly increased in membership in the span of my data sample from late October 2011 to early September 2013. Overall Hive has grown from 14 to 56 members since the network’s inception, and there were 28 members when the minigroup launched in October 2011. The following graph represents the growth of the Hive, in terms of number of member organizations, since the network launched in March 2009. To find these numbers, I triangulated information from historical Digital Media Fund Requests for Proposals (which list membership at the time of the RFP), the Hive Member Directory, and multiple blogs and websites that have documented the Hive. Still, note that because there was no single source that accurately states when every member organization joined, this graph should be seen as a “best guess” based on the available information.
It is also important to note that members of Hive NYC “HQ” are responsible for 25.3% (n=631) of minigroup posts. 53.6% (n=338) of Hive HQ’s participation is in the form of initial posts and 46.4% (n=293) is responses. Hive HQ’s high level of activity on minigroup is demonstrative of the role it plays in the network as a facilitator of communication. Hive HQ’s activity is distributed fairly evenly between initial posts and comments, which shows that it plays an important role not only in broadcasting communications but also in responding to the broader community.
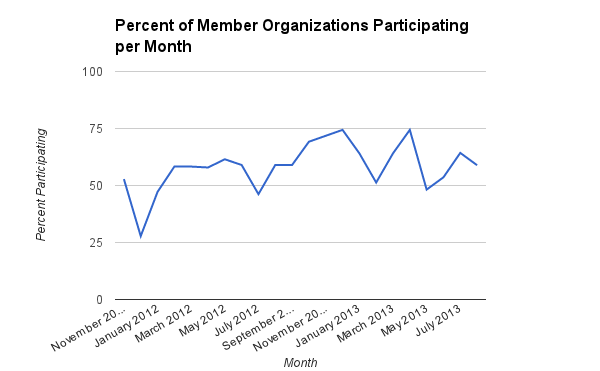
What percentage of Hive member organizations post to minigroup each month?
To conduct this analysis, I calculated the exact number of member organizations posting each month from November 2011 to August 2013 and combined that with the total number of Hive member organizations during that month to arrive at the percentage. These numbers show that the percentage of organizations posting each month has not consistently increased, despite the increase of activity on minigroup overall.
Next, I broke down the data on a more specific, organizational level. This gives some insight into how member organizations participate in the minigroup.
Organizational Participation
How many active minigroup members are there from each organization?
On average, 3 people from each participating Hive-affiliated member organization have posted in minigroup. This suggests that member organizations tend to have a few “Hive ambassadors” that participate in the minigroup, rather than involving many employees. Member organizations tended to have a similar number of average posters despite differing characteristics like organization size. The range of posters per member organization is 1-8, though very few organizations had more than 6 posters.³
Does organization size correlate with minigroup activity?
I thought that looking at minigroup activity in relation to organization size would be interesting because it is possible that larger organizations with more human resources might be over-represented in a number of different ways. To give context for following data, here is a chart showing the distribution of sizes of all Hive member organizations, measured by number of paid employees.
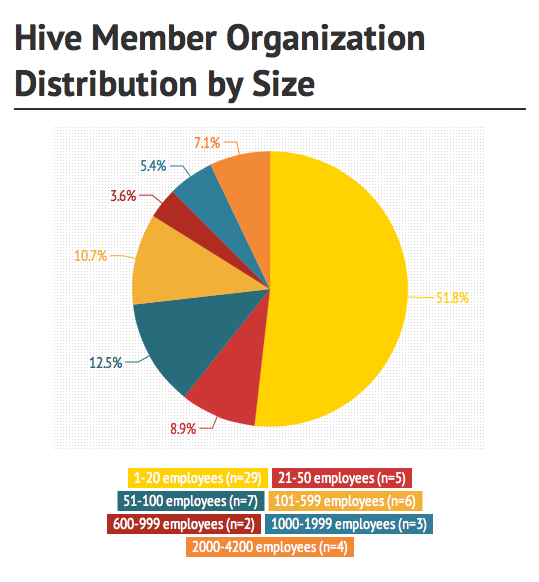
This demonstrates that while there is of course a diversity of organization sizes within Hive NYC, the majority of member organizations have less than twenty employees.
This next chart shows the percentage of the total member minigroup posts by organizations of each size category. As I mentioned earlier, I found the number of paid employees each member has through organizations’ websites and self reports, and these sizes are accurate as of Fall 2013. In order to directly compare this chart to the distribution by size chart above, I only included data from the 56 Hive NYC member organizations.
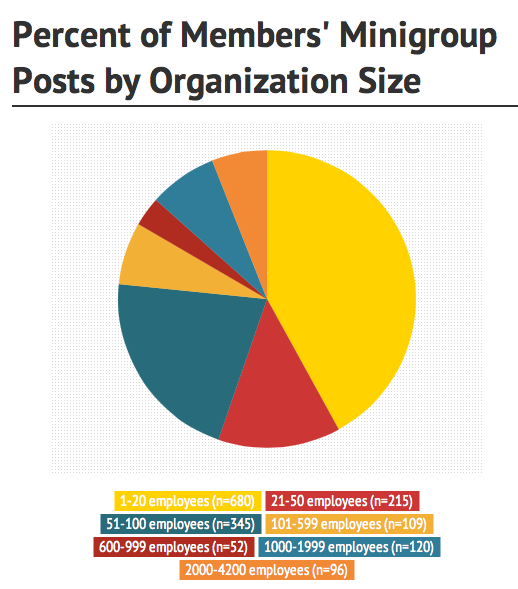
We conducted a correlation between organization size and activity, and found that the amount an organization posts on minigroup is independent of organization size. This means that there aren’t statistically significant differences in how a big organization participates versus a small organization. This could be a result of the “Hive ambassador” approach many organizations have adopted, which means that regardless of the number of employees an organization has, it has just a few people participating in the minigroup.
General Conclusions
To identify the significance and implications of this preliminary data, it is helpful to look at Hive NYC goals that might apply to minigroup. The Hive strives to create a rich learning ecology with networked behavior and open participation. There is a healthy number of non-affiliates that belong to and even post to minigroup, which suggests that the Hive is indeed following an open participation model. Still, almost 90% of minigroup members that are unaffiliated with the Hive do not post. Though the Hive itself has grown faster than minigroup activity, minigroup’s increase in participation also generally supports the Hive’s goals: it enhances networked behavior by providing a platform for member organizations to efficiently share opportunities and seek assistance, and supports open participation by facilitating and encouraging affiliated and nonaffiliated minigroup members to openly engage with one another.
The data also suggests that minigroup – and possibly the Hive – is a network more made up of people within organizations than a group of organizations. Essentially, though the Hive has whole organizations that are technically members, there tend to be a few key people from each organization actively participating, as demonstrated with the average number of posters per organization (3) and the lack of correlation between organization size and minigroup activity. Ambassadors can certainly bring news back to their organizations, but most employees from the organizations do not have direct communication with the Hive through minigroup. Qualitative coding will reveal whether there are patterns relating to organization size in the content of posts.
Though these numbers were informative, they pose many more questions. What are Hive affiliates – member organizations, Mozilla, Hive NYC “HQ”, New York Community Trust, etc. – posting? What are unaffiliated minigroup members members posting? How has the content of posts changed over time? Does organization size – and other factors I will explore, such as join date and receipt of Hive grants – affect the content of posts? Are there certain kinds of posts that elicit responses? Are there organizational characteristics that correlate with ways that an organization responds to posts?
I will examine these questions in the next step of my research, in which I will apply qualitative codes to minigroup posts and analyze them alone and in relation to the metadata in this post. By synthesizing these preliminary numbers with more qualitative data and analysis, I hope to provide a fuller picture of minigroup activity.
____
Footnotes
1. Hive affiliates include those associated with Hive member organizations, Mozilla, Hive NYC “HQ”, New York Community Trust, MacArthur Foundation, Hive MakerCorps, and Hive Research Lab.
2. There are four people who moved between organizations with the Hive and posted to minigroup from both organizations they were a part of. I counted each of these people twice in my data because organizational affiliation at the time of the post were an important part of the analysis.
3. This statistic only accounts for participating minigroup member organizations – I did not include the number of posters from the small number of member organizations that did not post during my sample period in the average.
