Hive Research Lab at the 2014 Digital Media and Learning Conference

Along with many of our colleagues from Hive NYC and many other Hive networks across the country, Hive Research Lab will be heading to Boston next week for the annual Digital Media and Learning conference. As many readers might be already be aware, the Hive Learning Network initiative emerged from the broader field of digital media and learning, building on the work of many pioneers in this space and centering its pedagogical commitments around Connected Learning, a research and design framework associated with this community. So, no surprise that Hive networks have a strong presence.

For those attending that want to check out the places where Hive Research Lab will be speaking, we wanted to share a round-up below:

If you’ll be going to the conference and would like to connect, keep an eye out and say hi!

[brief] Networked Innovation Interim Brief #1 – Innovations and Hive NYC

Over the course of the coming weeks, Hive Research Lab will be releasing a series of interim briefs, short form writing based on early observations and conceptualizations that are designed to provide the Hive NYC community with ongoing frameworks, findings and recommendations related to the Lab’s two research areas: supporting youth trajectories and pathways, and developing the Hive as a context for networked innovation. The briefs are part of a broader effort to connect current research and emerging findings to issues of practical importance to the Hive NYC community in order to improve network activity. Recommendations are preliminary and based either on existing literature or observations of practice within the network, and we hope that they can serve to spark conversations both within member organizations as well as across the network.

Hive Research Lab - Networked Innovation Interim Brief #1 - Innovations & Hive NYC - February 2014 cover imageOur first brief, which speaks to our Networked Innovation research strand, builds off of earlier work we’ve done to think about what counts as an innovation, but in it we take more of the perspective of what this question might mean for Hive members, as opposed to for our work as researchers. We include a set of “dimensions” that can be considered vis-a-vis a given innovation, consider how these dimensions might have import in the Hive NYC context, and provide a snapshot of things that might be considered innovations, broadly speaking, within Hive NYC.

Of course, thoughts and questions are welcome! Link to the brief is here.

What are the “practices” of innovation?

Previously we’ve written about how we define the “stuff” that might be considered innovations within the Hive – ideas, technologies, program models, and design principles are all the “things” or “nouns” that are the results of other activities. But what about the activities that bring these innovations about? These are what I refer to as  innovation practices. These practices operate on the level of verbs – they’re not things, but rather actions, activities, and processes. They make up the evolution or life-cycle of innovations, from brainstorming and iteration to implementation and scaling. Innovation practices are often so invisible and taken for granted that we thought it might be useful to name and offer some definitions here on the blog. Part of the idea in doing so is to let people in on the process we’re going through to theorize innovation in the Hive, but another goal is to give language to Hive members so that they might better recognize and call out things they do every day, activities that are central to how Hive works together as a network.

Sprout bulb in interative cycle

To offer a framework, we’ll draw on the work of James March, a scholar of organizational learning who famously offered [pdf] that the process of innovation can be broken up into two primary sets of activities – the work of exploration, and the work of exploitation. According to March, exploration “… includes things captured by terms such as search, variation, risk taking, experimentation, play, flexibility, discovery, innovation”, while exploitation “… includes such things as refinement, choice, production, efficiency, selection, implementation, execution.”

Put another way by the scholar Kwaku Atuahene-Gima, exploration encompasses a set of innovation practices that aim to develop new knowledge (broadly defined – ideas, technologies, program models, design principles, etc.) within a given context, and supports greater departures from current knowledge that exists in that context. And exploitation encompasses a set of innovation practices that aim to hone and extend current knowledge. Exploitation, rather than departing greatly from existing knowledge, hews closely to it in order to further and deepen it. It “exploits”, or makes the most of on an area that’s already familiar.

So what, more precisely, are the actual activities that make up these two areas of innovation? Based on what I’ve seen in Hive, on my own work experience, and on what the literature discusses, I’ve broken down a set of innovation practices I see as belonging in each of these buckets.

Exploration might include the following:

  • Exposure – the act of encountering an innovation or information about an innovation without specifically seeking it out.
  • Search – the act of actively seeking out an innovation or information about an innovation in a directed and intentional manner.
  • Sense-making – the process of coming to understand the nature of an innovation and/or the innovation’s potential relationship to a given actor’s goal(s). Sense-making can be intentionally undertaken as a practice, or more organically occur without specific direction on the part of an actor.
  • Ideation – the practice of intentionally generating ideas for potential innovations that might be further developed by a given actor.
  • Prototyping – the practice of creating early-stage pilots or models of a given innovation for the purposes of gaining information that would further the design.
  • Experimentation – the practice of engaging in early-stage implementation of a prototype within a variety of contexts with the intention of gaining information that would further the design.
  • Refinement – the practice of using information gained through prototyping and experimentation processes in order to change central aspects of an innovation’s design.
  • Iteration – the practice of repetitively engaging in cycles of prototyping, experimentation and refinement for the purposes of systematically improving an innovation. 
  • Recontextualization – the practice of adapting a given innovation to a particular context to better meet the needs and priorities of said context.
  • Reinvention – the practice of re-conceptualizing a given innovation such that it takes on a substantively distinct new form.

Obviously, many of these practices are overlapping or encompass one another. For instance, “iteration” is a sort of meta-practice that subsumes prototyping, experimentation and refinement. The processes of “recontextualization” and “reinvention” imply that exposure or search must have occured, as well as some sort of sense-making. Each of these practices though offers a distinct lens into the larger process of exploration.

Exploitation, on the hand, includes a very different set of practices such as:

  • Production – the creation, manufacturing or design of a given innovation at a degree of refinement and scale such that it is ready to be implemented in its intended context of use.
  • Implementation – the execution and/or release of a given innovation within its context of intended use.
  • Establishing Efficiencies – refinement to non-core aspects of an innovation or the processes surrounding the production or implementation of an innovation for the purposes of making its continued production or implementation less resource intensive.
  • Institutionalization – the development of increased capacity, knowledge and expertise vis-a-vis a given innovation within an organization or system.

We could possibly leave the story of innovation practices at those two buckets of exploration and exploitation, but as I looked at the Hive and considered the networked nature of innovation that occurs here, two other linked practices seemed to be important: documentation and circulation, defined below:

  • Circulation – formal or informal sharing of an innovation and/or information relating to an innovation across multiple actors (individuals, organizations, systems). Actors engaged in circulation may or may not be associated with development of the innovation.
  • Documentation – the practice of creating artifacts and reference materials relating to a given innovation to help achieve a variety of functions across the spectrum of innovation practices.

In terms of “networked innovation”, these practices are central to the ways that innovation is captured, spread, and accumulated throughout the network, operating as a sort of connective tissue in terms of innovation. They speak to the process of “diffusion of innovations“, made famous by innovation scholar Everett Rogers.

So what do we make of all this when we think about studying innovation in Hive NYC? In general, part of why we go through the process of developing such layers of theory is so we can get a better sense of what activity is actually going on, and where to focus our energies and attention as researchers. In the context of the Hive, the practices of exploration and circulation seem to be the most relevant. In terms of exploration, the discourse of the network is generally oriented towards experimentation with new ideas, technologies and programs, something encompassed by exploration practices. And in terms of circulation, many Hive-supported activities, including partnerships, meet-ups, learning lab and community calls are heavily oriented towards sharing what people are working on and spreading knowledge across the community. These circulation practices in the network also feed back into such central exploration processes as search, exposure, sensemaking, recontextualization and reinvention. Exploration and circulation practices both inextricably tied to one another in a networked context, and as such are central as we study what Hive is up to.

Where do we go from here then? Two things have emerged for us as critical as we’ve started to conceptualize innovation practices, both of which have emerged from our fieldwork.

The first is that it’s become increasingly clear that the real value here is in understanding the particular ways that organizations string all of these different practices together. If these individual practices are the innovation equivalent of walking, we want to understand and be able to talk about how Hive organizations dance, whether it be on their own, in pairs, or in epic choreographed ensembles (if that makes sense!). This means being able to speak to how the different innovation practices I’ve talked about here are coordinated into larger patterns of organizational behavior and strategy, and how being part of a network intersects with that.

The second thread we want to pull here is about language. A lot of the literature on innovation isn’t really native to the educational world, and some terms (like exploitation, for instance) don’t really resonate with the culture and ethos of the Hive. While such terms might be useful analytically, we’re curious to learn more about how Hive organizations talk about the ways they engage in the activities we described here. Some things we know have become common parlance – prototyping, iteration, playtesting – but we’re sure that there’s a lot of other ways that Hivers talk about how they engage in innovation, and we’re curious to hear from people on this front.

Prototyping a Network-level Design Research Process

photo_2

One of the guiding principles of the Hive Research Lab model is a tight coupling between practice and research. Practical needs and concerns informed the development of our core research questions, and ideas from the academic literature base and the basic research we’re conducting are meant to inform practice on the ground. And the idea of engaging in co-design experiments with Hive NYC network members emerged from this same spirit of being an applied laboratory at the intersection of theory and practice. All of this sounds well and good on paper (and in theory!), but the actual nuts and bolts of collaboratively developing new things within the network and then researching them is quite complicated and has potentially infinite permutations on the ground. So in developing what this design process would look like in practice, we went back to our first principle – tight coupling between researchers and practitioners. We knew we had to talk to and work with Hivers even as we were planning and developing the practical aspects of the co-design research work to make sure that we get it right when we do our full fledge launch of that work (we always joke about how meta we are in the lab…).

So in late October, we held a prototyping and focus group session with a group of Hive NYC members about our co-design research process. In doing so, there was a lot that we wanted to get feedback on. What sort of value did they think Hive members might get from participating? What did they see as likely challenges? Had they engaged in cross-organizational co-design processes before? If so, what worked or didn’t work in the past? Prior to our session we brainstormed probably a dozen and a half questions that we’d been chewing on and that we thought this group might help us to answer. We knew full well that we wouldn’t be able to get answers to everything, but also knew that having a good sense of our “known unknowns” would allow us to make the most use of the collective intelligence of the group.

Based on the core areas we were curious about, we structured the half day meeting into two parts: engaging in a mock (and rapid) design activity around the issue of supporting youth trajectories and pathways, and then having a free flowing, focus group-esque conversation where the group both reflected on the design activity they just engaged in and gave feedback on what it might look like to engage in a more prolonged and robust collaborative design process with Hive members.

While we won’t go through the blow by blow of the design activity and the entire conversation that followed, we did want to share what we saw as the major points of feedback that the group provided:

  • Provide a very clear sense of the value proposition for participation in a collaborative design process.
  • In providing a value proposition, give prospective participants rationales that both speak to them personally (as people likely already invested in the idea of Hive to varying degrees) as well as ones they can use within their organization to justify taking the time, effort, and, potentially, organizational resources that might be required.
  • It’s likely much easier for Hive members to plan ahead to participate in a 1-2 day intensive charette or hack jam style event than it might be for ongoing engagement over the course of a, say, six week process. One model to consider might be holding an intensive charette and then empowering and supporting groups and projects that come out of that in a more tailored fashion that doesn’t need to involve all original participants.
  • Be sure to capture what Hive members see as core challenges to reaching the design objectives that they’d be working towards.
  • Frame problems and possible design solutions in “if/then” format. For example, “If we want to better support robust youth trajectories and pathways for learners in Hive NYC, then we need <insert design solution/proposal/practice/project here>.”
  • Don’t shy away from presenting participating Hivers with very specific design problems that are sub-issues within the areas of interest, just being sure to leave space for them to totally do their own thing. For instance, for the goal of better supporting youth trajectories and pathways, we can leave that as a basic design space to work in, but also provide specific areas such as “design a way to improve pop-up events so that they operate as ‘on-ramps’ into further engagement”‘ or “design a way that youth coming from Hive member organizations can find internships in areas they’re interested in”, etc.

Moving forward, we’re going to take the feedback we got and work in the next month or so to solidify our plans for the first co-design cycle to launch after the new year. In doing so, we’ll combine what we learned from this prototyping session with the insights from related research methodologies including design-based implementation researchparticipatory design, and participatory action research to gain additional perspective on what others have done, the challenges they’ve faced, and the successes they’ve had.

Defining Innovation in the Context of Studying Hive NYC

One of the challenges of studying innovation here in Hive Research Lab is that the word has become so loaded in our discourse. Its ubiquity often Sprout Lightbulbrenders it meaningless, and so as researchers working with this idea we need to be clear on what exactly we’re talking about when we say innovation.

The first thing to say about innovation is that, like many other words, it exists in our language in various forms. For example, take these four ways of using the word in context:

  • “Our organization needs to produce more innovations!” (noun form)
  • “Our organization needs to do more innovation!” (verb form)
  • “The thing that organization made is totally innovative!” (adjective form modifying a noun)
  • “The experimentation that organization does is so innovative!” (adjective form modifying a verb)

So when we say we’re studying innovation, we have to be clear about which form of the word we mean, because that has implications for how and what we track as part of our research process. For the purposes of this post, I’ll focus on the noun form, i.e., the “things” that we might call innovations. (In a future post, I’ll discuss the the verb form, which comprises the actions and processes that lead to those things.)

In reviewing the academic literature, we’ve found five dimensions that are usually referred to in some way when characterizing an “innovation”:

  • “Value Added”/Beneficence of an Innovation – this dimension speaks to the normative qualities of an innovation. Is a given practice/technology/idea “better” than what came before it? This begs the questions of according to whom, and by what measure? Definitions that focus on “value added” imply an evaluation of some sort.
  • Novelty of an Innovation – almost all definitions focus to some degree on whether something might be considered new, though novelty is acknowledged as variable based on context (“absolute” vs “relative” novelty). New to an individual, new to a team, new to a firm, new to a field, etc. can all be considered and specified within a definition of innovation. Also referenced here is “perceived” novelty by a given actor.
  • Form of an Innovation – innovations are often grouped according to some form that they take, such as product innovations, process innovations (which refers usually to innovation processes themselves, eg – a rapid prototyping approach, assembly lines, supply chains, etc.), or organizational model innovations. This can be extended in other ways, delineating various forms like technologies, practices, program models, design principles, etc.
  • Origins of an Innovation – was the innovation internally conceived or externally adopted, or some combination? Obviously, on a micro level, all innovation is some combination, but various ways of operationalizing and measuring could likely determine whether an innovation has an external or internal basis in relation to the unit of analysis (individual, team, organization, field, nation, etc.).
  • Degree of an Innovation – is an innovation a radical departure from existing approaches within a unit of analysis, or an incremental improvement? Again, degree can be contextually determined. Something might be a radical departure from existing practice in one organization, but is considered just an incremental improvement from the level of the field.

In getting to a definition of innovation, each of these dimensions is something we think about, with a general rule of thumb being to ask ourselves the questions “Is that aspect of innovation something that actually matters to us in studying Hive NYC? Does it do work for us in our investigations?”

While I’ll talk more in later post about innovation processes and practices, one emerging hypothesis concerning innovation and Hive NYC is that membership in the network mediates exposure to, circulation of and experimentation with ideas, technologies and practices relating to learning. Because of this hypothesis, we’re looking to operationalize innovation in a way that allows us to identify innovations in order to investigate the nature of that mediation. The focus on the practices/processes of circulation, exposure and experimentation for us imply a need to use a definition that focuses on perceived novelty and, potentially, perceived beneficence (value-add), rather than some sort of “objective” evaluation of novelty or beneficence. This allows for a greater focus on the processes surrounding an innovation, given that it is easier to decide that something is an innovation and then track how it’s treated and related to without having to conduct an extensive evaluation of the internal qualities and/or efficacy of a given innovation by some objective measure.

Based on these considerations, the working definition we’re using here at Hive Research Lab for usage within the context of studying innovation within the Hive is the following: An innovation is an idea, practice, principle, technology, or other mediational object perceived as new and of value by an individual, team, organization, field or other entity.

Given that definition, there are a variety of things that might then be considered innovations in the context of Hive NYC:

  • Learning technologies, some developed outside of the network and then adopted (like MIT’s Scratch) and others developed within member organizations (like The LAMP’s Media Breaker).
  • Disciplinary oriented pedagogical practices, like youth game design, citizen science, youth journalism, etc.
  • Program Models and/or Curricula, like NySci’s C3 citizen science work, or Global Kids’ NYC Haunts series of programs.
  • Design principles, like creating learning environments that are interest-driven, or production centered.

The key here is that according to the definition we’re using, none of the above are innovations by default – it’s always contextual. Does a given organization or individual we’re looking at see one of these are novel and of value? Because we’re looking at a network where there’s lots of experimentation with and circulation of ideas, we wanted to make sure that we could focus on the contextual nature of innovations for different actors, and see how the network intersects with those.

We’ll post soon on innovation processes and practices, which we see as a central part of understanding how Hive NYC operates.

Visualizing Hive NYC – Part 2

This past Spring, members of Hive Research Lab worked with students in Indiana University’s IVMOOC, an online information visualization course, to take data about Hive NYC-funded projects and partnerships and see what sorts of interesting patterns might emerge through different visualization techniques. In this two part series, we interview each of the two teams of students  that worked with the data to have them share their process, the visualizations they came up with, and reflections on what it was like working with Hive NYC data.

One qualification to note: as the data these visualizations was based on were sometimes incomplete and also self-reported, these should be treated more like prototypes for how we might represent Hive activity, rather than definitive statements of what activity has been.

In this post, we talked with Team EsHkUsNl, made up of Gloria Jimenez, Elwin Koster, Maria Maza, Carmen Ng, Chantal Melser and Kristina Simacek.

Hive Research Lab (HRL): Tell us a bit about your approach to visualizing Hive NYC. What kind of process did the team go through?

Team EsHkUsNl (TE): With an international team spanning the globe, we were challenged to collaborate across different time zones and to learn and draw on each other’s strengths.  Using social media, including Google+ hangouts, we were able to facilitate regular collaboration. We were inspired by the fun of doing an online course, and as we progressed in the project it became more of a professional endeavor.

As for the work itself, we approached the project through extensive discussion and sharing of different approaches to visualizations, providing examples from each of our backgrounds and trying to pick out the main elements from each visualization to put together a final visualization that took into account both our desire for a clear and useful visualization as well as balancing the limitations of the data.  In analyzing the data, we went through several iterations of visualizations to determine what would best represent the data in a useful way. Each visualization is a multi-layered process, and in the final visualization we attempted to show multiple layers at the same time so that both an overview of the data and specific elements of the data could be shown at once.

We appreciated having the flexibility to come up with what we thought was important to show to key stakeholders, including administrators, donors, organizations, and youth.  This allowed us to think freely about what we wanted to show, and experiment with different kinds of data visualizations.

HRL: Let’s have a look at the visualizations that the team produced. What do you think they show about Hive NYC?

TE: Here’s the first visualization we came up with:

Hive NYC TreeMap

Tree Map of the Hive

First, we tried a tree map to highlight how much financial resources were going into different grant categories. This revealed the dollars split down into project and partner organizations. Clearly, the Catalyst grants receive the most money, the Link and Lever grants have less weight in this.

Hive network

Network Visualization of Hive NYC

Next, we explored a circular network diagram, in order to be able to see the connections between organizations and incorporate the amount of dollars involved by position in the circle. 12-o’clock is highest amount of dollars, then clockwise the amount of dollars decreases. The nodes are sized and colored by the number of youth reached. We realize some of that is sort of skewed though since there were some apples to oranges issues with the youth reached data, as some were counting large online audiences with limited engagement, and others smaller groups with more intensive engagement. We realized that visualizing “impact” in this way can be a little bit of a challenge in terms of telling the story of what’s actually going on in these programs.

circos hive ok white

Bipartite Circular Visualization of Hive NYC

For our final visualization, we decided to use a tool called Circos, which places network data in a circular map. With this tool, it is possible to order nodes, select colors for edges, and indicate sizes of edges.

The Circos approach enabled us to place each project in order of season during which the grant was awarded, and to color-code linkages by award type, while sizing linkages by award amount. In cases where multiple groups were involved in the project, the award amount was split among the participating organizations to sum to a total for each project. This approach also minimizes the impact of outliers while allowing for a quick overview of the network with the possibility of zooming in or out to see specific information.

Colors of the “ribbons” in the visualization represent the type of grant awarded to the project. The type of grant is particularly interesting because it delineates the amount of money available and the expected size and scope of the project. Knowing this is important when comparing the relative impact of different projects. For example, a Spark grant is for up to $25,000 to explore a new idea or new direction for one or more organizations, while a Catalyst grant is for two or more organizations to develop a prototype/pilot program at a cost of $25,000 to $100,000.

We think that the visualizations that our team produced show the diversity of projects within Hive NYC.  This diversity in themes and types of organizations involved yields potentially wide-reaching impacts to a number of youth.  We can see from the visualization the variety of types of projects in which each organization is involved through their participation in Hive NYC.

HRL: Visualization is no easy task. Based on what you all learned through IVMOOC, what would you say are the potentials, but also the limitations, of using data visualization techniques to understand a context like Hive NYC?

TE: A widespread saying goes that an image is worth a thousand words.  Yet, it is also easy to lie with images.  In showing data within a data visualization one must be aware of what one is showing and how, as well as how it may be interpreted in different cultures.  This can make creating a data visualization quite complex. A limitation we ran across, and which would be an issue in any data visualization project is the question of what to show and what to leave out.  Particularly as data sets get larger and include more types of information, the question of what parts of the data to highlight and how becomes paramount.  In this way the potential to hone in on important themes in the data is great, yet there is always some loss of data in order to keep the data visualization from becoming cluttered and confusing.  This makes interactive visualizations particularly useful, as parts of the data set can be highlighted at different times.  Yet, interactive visualizations are also limiting because they cannot be used, for example, in print.  Furthermore, creating interactive visualizations requires highly specialized skills that may not be available.

Data visualizations can allow for presentation of what might otherwise be dry statistical information into a format that can be interpreted by a wider audience.  “The brain doesn’t just process information that comes through the eye. It also creates mental visual images that allow us to reason and plan actions that facilitate survival.” [A.Cairo, The Functional Art (2013), p. xvi]. In this way, and based on this citation we should see the data visualization as a new way to communicate data in a way that fits with the more modern ways of communication.

HRL: You all have largely been doing this work sort of in isolation of actually interacting with folks from Hive NYC, but now you’re getting a chance to talk to the network directly. Any general reflections you’d like to share?

TE: One point we struggled with in visualizing the Hive NYC data was how to show the impact of the projects on youth so that stakeholders can see how effectively their dollars are being used.  This must be understood also in the context of the types of grants offered by the Hive Digital Media Learning Fund, as some are intended to fund pilot projects, while others aim to substantially expand existing or previously piloted projects. In this way, data visualization can be used as an instrument to inform potential donors as to how their donation can make a difference in the lives of youth.

As a team working on a graphical representation of data we have clearly learned the value of such kind of visualizations in modern society, and we definitely believe it might be valuable for the Hive NYC to provide more opportunity think understand and create visualizations. Not only for the youth, and also for the organizations involved.

HRL: As some of you might know, part of our mandate at Hive Research Lab is to show how data and research can be used to advance the practice of Hive as well as communicate its activity to broad stakeholders. How do you think the work you all have done here helps to build a case for the utility of research for practitioners?

TE: We believe, as we said in our answer above, that using this way of visualizations as an instrument to inform both the stakeholders and the participants is a very powerful tool. Making the right combinations in your visualizations, in addition to displaying direct impact of funding on projects and youth, may show unexpected links that can trigger both the organizations as well as the funders to think of new projects and new directions.  Visualizations are a useful way to make a strong case for the success and challenges of implementing programs such as those in Hive NYC.

HRL: Thanks so much for sharing your perspectives, and for providing some new ways of making the activity of Hive NYC visible!

TE: You’re very welcome!

Visualizing Hive NYC – Part 1

This past Spring, members of Hive Research Lab worked with students in Indiana University’s IVMOOC, an online information visualization course, to take data about Hive-funded projects and partnerships and see what sorts of interesting patterns might emerge through various visualization techniques. In this two part series, we interview each of the two teams of students that worked with the data to have them share their process, the visualizations they came up with, and reflections on what it was like working with Hive NYC data.

One qualification to note: as the data these visualizations was based on were sometimes incomplete and also self-reported, these should be treated more like prototypes for how we might represent Hive activity, rather than definitive statements of what activity has been.

In the first post of this two part series, we spoke with Team Buzz Buzz, made up of Simon Duff, Camaal Moten, John Patterson, Ann Priestley and Sarah Webber.

Hive Research Lab (HRL): Tell us a bit about your approach to visualizing the Hive. What kind of process did the team go through?

Camaal Moten (CM), Team Buzz Buzz (TBB): We began the process by identifying our research questions, thinking about potential Hive NYC needs, and hand-sketching some ideas to explore the various visualization techniques we were learning each week. Our low-fidelity sketches allowed us to quickly problem-solve and be creative, while providing a basis for discussions between the team and Hive Research Lab. We used components of the exemplary visualizations shared during class as a starting point, and then worked within the team provide feedback on each other’s ideas. After a few rounds of discussion, we decided upon two visualization techniques and began adding more detail to each sketch to match the dataset.

We then began cleaning the dataset and made a normalized version to maintain consistency throughout the team and began appending the unique data needed to create our proposed visualizations. For example, John used the member locations to append the latitude and longitude coordinates to the dataset for our geospatial visualization. We also gathered background information on each organization and looked for new ways to interpret the data or additional data points that could be added.

As the project progressed, we used a shared Google+ community page to post examples of preliminary results from the dataset and provided each other with feedback. We continued this process until we created a high-fidelity visualization that matched our sketch. This iterative process of cleaning, parsing, and visualizing the data continued throughout the entire project. Each cycle of feedback inspired new visualization ideas and expanded the final results. We spent most of our time transforming data, so one of the highlights was when one of our team members created a script that could automatically transform our excel data into the Graph Exchange XML Format (GEFX) used in Gephi (an open-source data visualization application). In the end, we added even more visualizations that were not included in the original scope. We were having too much fun!

John Patterson (JP), Team Buzz Buzz (TBB): I think Camaal covers it well. Interestingly, the majority of the time visualizing Hive NYC was spent on data organization and data transformation and not on the visualization itself. What felt different about data visualization compared to some other data analysis approaches is that we constantly faced new challenges requiring a mix of skills. For example we wanted to show Hive NYC as it changed over time, so we needed to get the data into GEXF format. There was a “Wait how do we do that?” moment and Simon (the programmer in our team) was able to solve that challenge and write a short script. This meant Camaal (our designer/social network analyst) could then get back to visualizing. So the process required lots of collaboration. Google+ really surprised me in how easy it facilitated this kind of work.

HRL: Let’s have a look at the visualizations that the team produced. What do you think they show about Hive NYC?

  collaboration_network_1

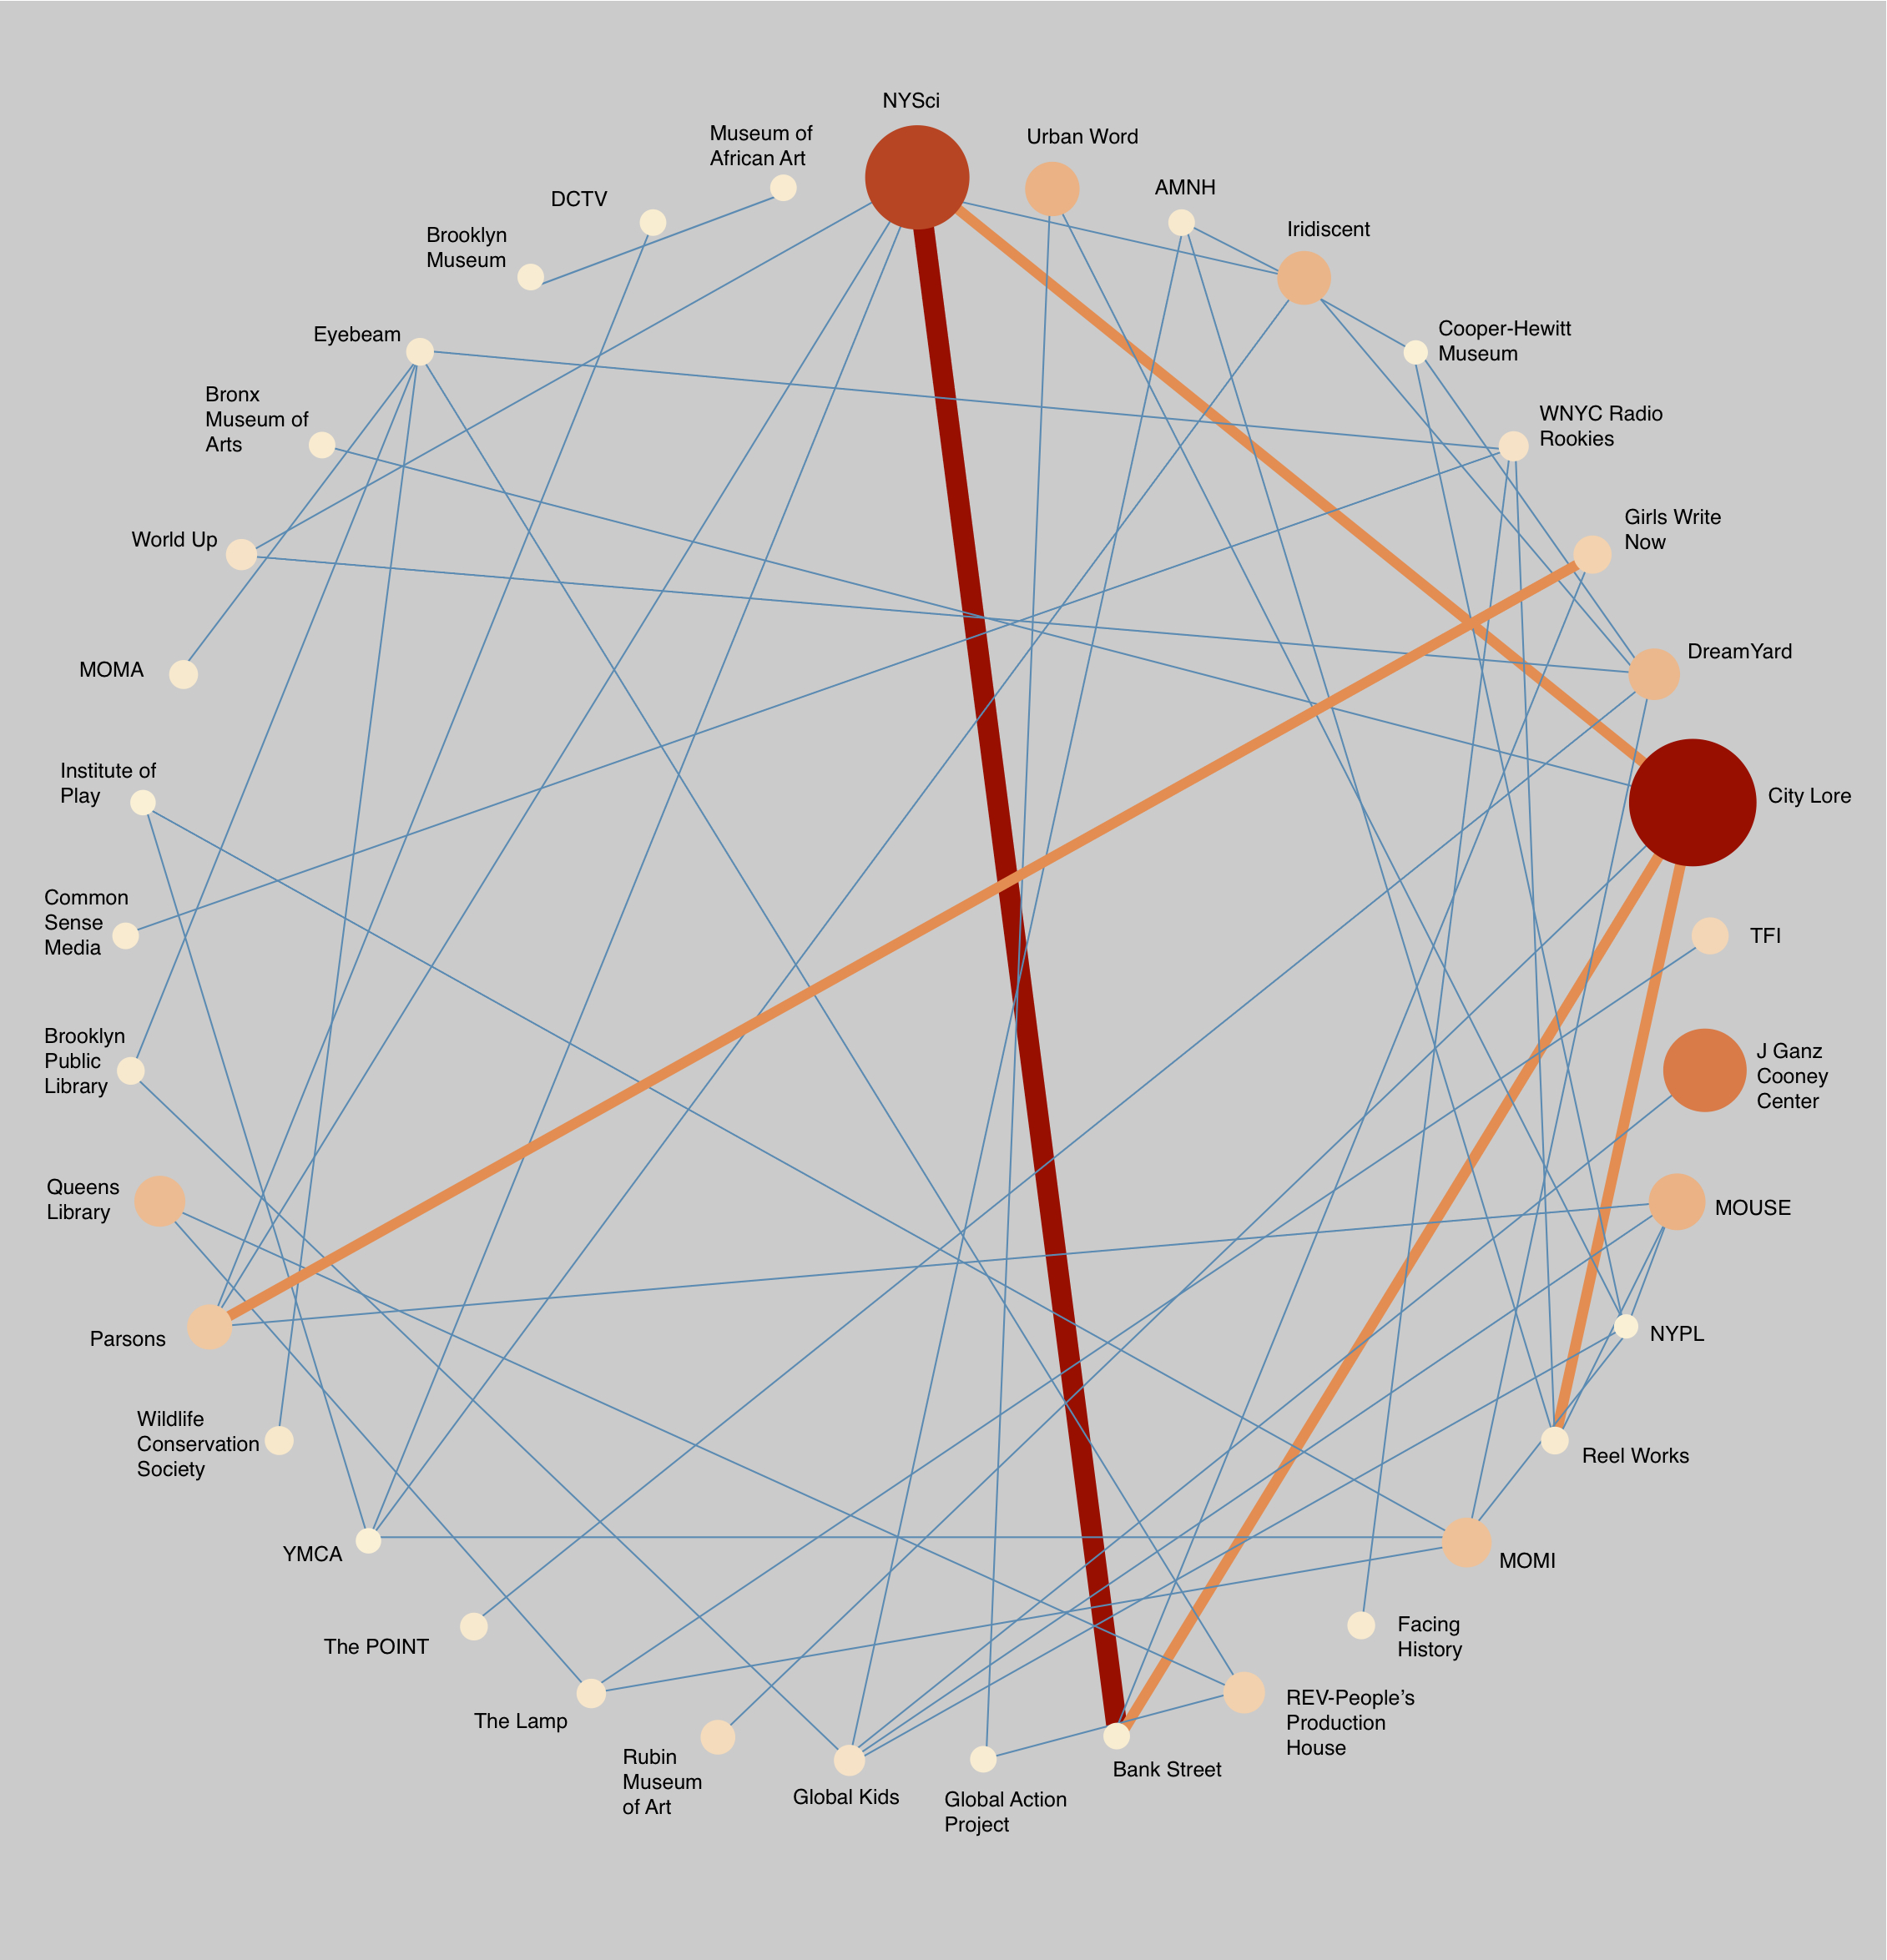
Collaboration Network Visualization (click for hi-res version)

CM, TBB: The collaboration network visualization illustrates the relationships between Hive NYC members and highlights which members were the most active regardless of their role (e.g., lead or partner) on projects. If you follow the arrows, you can also see which members acted as leads vs supporting partners on collaborations. If you compare those data to the bipartite visualization below, you notice that some of the largest grants were only shared amongst a few members. While they received large grants, it didn’t always translate into a large amount of youth reached. The members with the highest impact on youth served a variety of roles on numerous projects, which reinforces the idea that organizations that collaborate will thrive.

bipartite_network

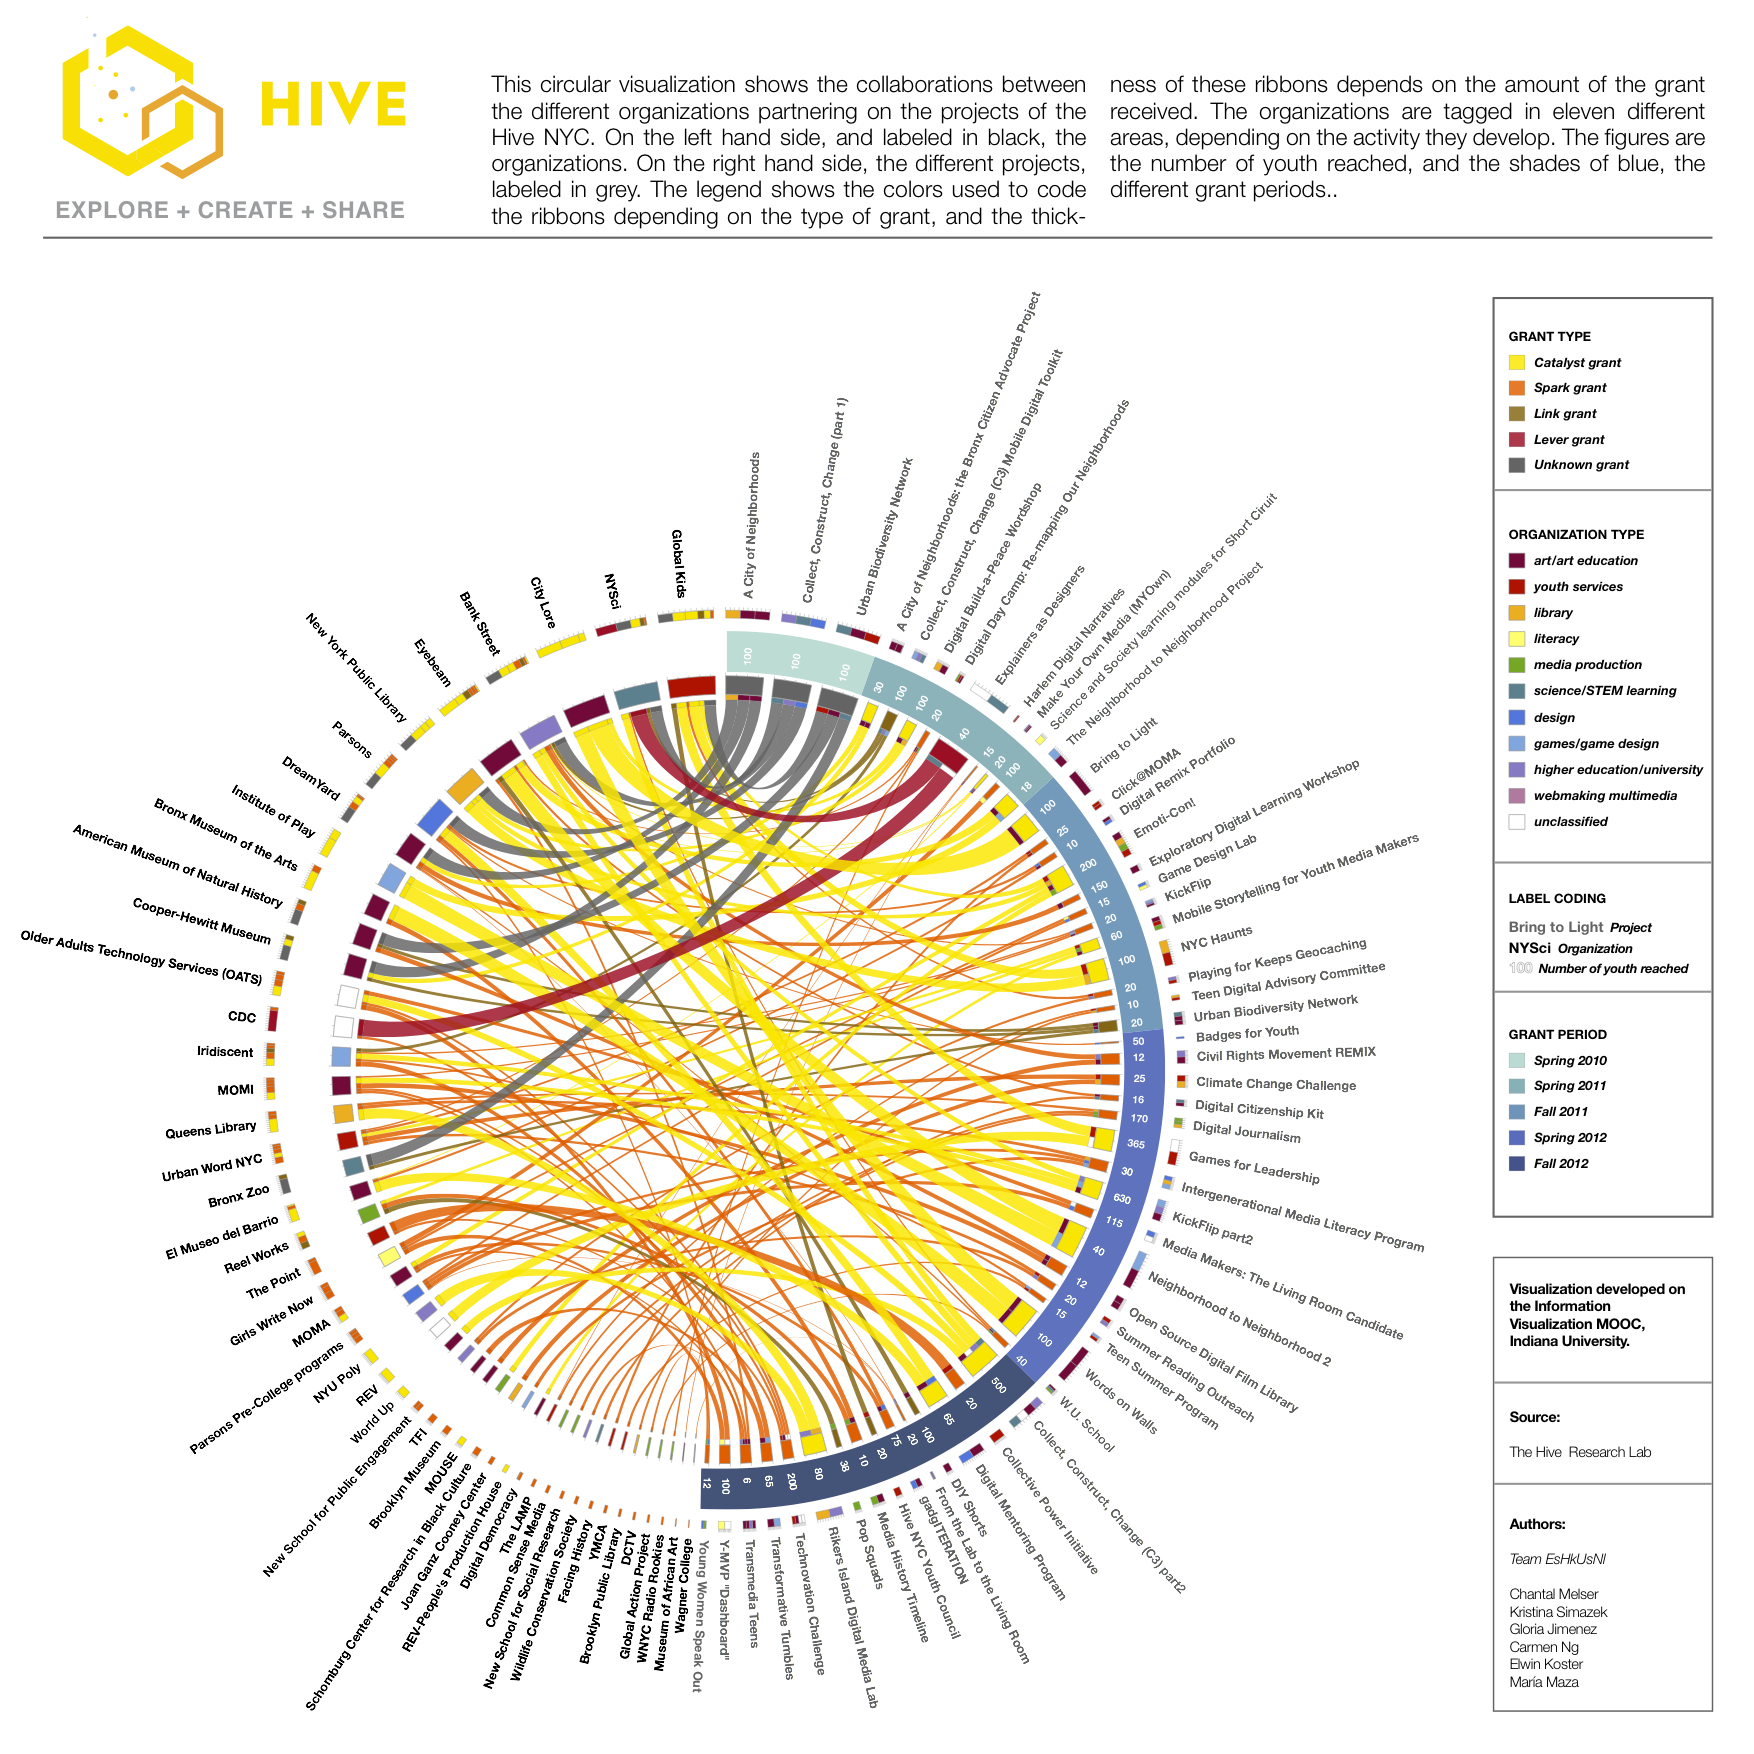
Bipartite Network Visualization (click for hi-res version)

The bipartite network demonstrates the connections between Hive NYC members and projects and highlights which members worked on the most projects, their role, percentage of overall reach, funding, and effort. We added a table on the side to illustrate which members were the most collaborative, funded, and impactful in the community based on youth reached. For example, WNYC Radio Rookies primarily served as a partner on numerous projects with various amounts of funding and contributed to the greatest percentage of youth reached. They were not rookies at collaboration.

temporal_network_1

Temporal Network Visualization (click for hi-res version)

If you look at the temporal network, we attempted to show how the relationships between members form and are sustained over time across funding cycles. The visualization is based on the notion that all members exist from the beginning and the ties between them are defined by the collaborations on funded. Of course we don’t mean to say that they don’t have relationships outside of these collaborations, just that this visualization is, from an analytic perspective, just based on those particular partnerships. As you scroll through time, you can see that the social network among organizations begins to take shape over the course of various funding cycles. You would expect to see that behavior, but what’s interesting is how certain members begin to form communities that were maintained through various projects. We didn’t know why certain organizations partnered with each other, but it seemed evident that they formed enough of a relationship to continue working together on future projects. Unfortunately, the visualization is really small and we removed the member (node) titles to reduce clutter. The collaboration network graph above provides you with a combined view of the connections between members independent of time.

JP, TBB: The collaboration over time [temporal] network was added late on, but was really useful as it gives a different view of the network than you might otherwise be imagining. Throughout the project I had always imagined that Hive NYC was a constantly evolving and growing network with more and more ‘live’ relationships developing. Then the temporal prototype appeared and I thought wait – you could see it as the relationships are forming and then sometimes disbanding. What does this way of looking at it mean in practice? How do relationships continue after a project? (perhaps a survey of organizations could shed light on this). As Camaal says it was evident there were some repeat collaborators but we didn’t have insight into why.

In some ways the new questions the visualizations ask are as interesting as the ones they answer!

geospatial_network1

Geospatial Network Visualization (click for hi-res version)

The geospatial network showed some great aspects of how Hive NYC exists as a regional network of organizations. There was a clear ‘hub’ of organizations but then what seemed to be some strategic links out to more distant providers like NySci and the Bronx Zoo.  To me, it works well as a quick glance overview. What our visualization missed here however is delivery sites – an organization might have their central offices in one place but have actually implement their programs elsewhere. We weren’t able to highlight this but it would be really interesting to plot that and then perhaps overlay it onto the income distribution for an area, and thus determine precisely where and to whom Hive NYC is delivering projects to.

Scale is also limiting on the geospatial network – it was really difficult to fit it all in and leave some meaning there.

HRL: Visualization is no easy task. Based on what you all learned through IVMOOC, what would you say are the potentials, but also the limitations, to using data visualization techniques to understand a context like Hive NYC?

JP, TBB: I think, from my angle as an analyst, the key is to be aware of the potential and limitations of the data itself. I mean there are always limits to what the data tells you and how you can use it.

An example from Hive NYC are that the data on grants awarded is available for all projects but the projects are all so different. There are some projects for example that only reached say 15-30 young people but when you dig deeper they were 3-4 months long, and I expect much more intensive, compared to other ‘massive reach’ projects (I think one reached 10,000?) but which was perhaps an online broadcast type project so the value of the interaction between organization and learner is smaller. So while we can say ‘it cost, on average, between $1,000 to $2,000, per student reached’ and we can visualize that, it’s still, well, it is a very broad measure and that has implications for the meaning of the final visualization. There’s also things like the fact that Hive NYC promotes innovative projects which are often untested so not reaching a large number of youth, or high costs aren’t necessarily always the important thing but that’s where the visualization , the data, led us.

Simon Duff (SD), TBB: I agree with John’s assessment on some of the limitations of focusing on a small number of visualizations — different approaches can be used to promote or hide some aspects of the data over the other, such as highlighting short projects that help a large number of candidates, over smaller number of candidates being involved in longer, and possibly more enriching or experimental, projects.

HRL: You all have largely been doing this work sort of in isolation of actually interacting with folks from Hive NYC, but now you’re getting a chance to talk to the network directly. Any general reflections you’d like to share?

CM, TBB: Thank you for the opportunity to play with your data! It’s evident that the network’s approach to learning and engagement helps spark curiosity and exploration. It would be amazing to see an overlay of how each project improved the educational performance within local schools within your community. And as the network believes that learning should be driven by interests, it would be nice to have an overlay of that data to see how interests played a role in the amount of students reached and/or partnerships formed amongst the members. The tagging system you’ve established on the blog could be leveraged to create a tagging taxonomy for projects and members. It would also be interesting to see which members and projects incorporated various forms of digital media.

JP, TBB: Yes – thanks for putting this data out there. It’s really intriguing to think of all the data that’s collected by organizations and might be sitting there full of useful insight but may be, perhaps,  never used. Putting information out, through MOOCs or otherwise is a great idea.

From another angle – talking to Hive NYC earlier may have meant the final product took a very different direction. I think it’s difficult without the right kind of access to a client to ask the questions and seek clarification on how the organization works. What we never got chance to do early on was say “So what exactly do you want to know?” and ultimately that is the driving force for everything after.

HRL: As some of you might know, part of our mandate at Hive Research Lab is to show how data and research can be used to advance the practice of Hive NYC as well as communicate its activity to broad stakeholders. How do you think the work you all have done here helps to build a case for the utility of research for people outside of the ivory tower?

JP, TBB: I think there’s so much opportunity here – it would be interesting to see if different approaches to practice work better (e.g. A/B testing within projects), in putting more data out there (e.g. outcomes for cohorts in a program) and in using existing data in new ways (e.g. visualizations).

SD, TBB: I think it would be enriching to see the data you’ve collected correlated with other data sets. As mentioned by Camaal earlier, it would be great to see how education results have improved by those attending projects by Hive NYC, and even follow individuals to see if their future careers have been influenced by different projects.

HRL: Thanks so much for sharing your perspectives, and for providing some new ways of making the activity of Hive NYC visible!

TBB: You’re very welcome!

What’s your organizational “interface” with the Hive?

As we’re coming towards the end of our preliminary fieldwork phase to get a snapshot of Hive NYC, we’re starting to see that member organizations “interface” with the Hive in very distinct ways. For example, we’re noticing that in a number of larger organizations, the relationship to the network and its associated opportunities is managed by one individual within a specific programmatic department, with development (i.e., fund raising) folks coming into the picture when the organization responds to a Hive RFP. In some smaller ones, we’ve seen a range of set ups, from executive directors being the only one in the organization that even knows what Hive is (common with some of the newer small organizations), to others where teams that span leadership and programmatic roles attend Hive community meetings together. In still other cases, we’ve seen “hand-offs”‘- an instance where someone moves on from a position and was a “point person” to many Hive-affiliated relationships and activities, and then moves out of that role, explicitly giving it to another person in the organization.

This brings up the fact that there are so many things that we might count as an “interface” with the network (and what the network actually *is* from an analytic perspective is a whole other post). Any of the following might qualify:

  • being on monthly community calls
  • attending monthly in person Hive meet-ups
  • participating (or just lurking) on Hive’s mingroup email list
  • running an activity station at a one-day Hive-affiliated pop-up event
  • submitting an application with other Hive members to the bi-annual Hive RFP
  • running a Hive funded program or partnership
  • taking part in “learning lab” calls that occur for each cohort of funded Hive projects
  • …and probably a whole bunch of things we’re either forgetting or don’t know about yet.

So why does this all matter? Well, as a project that’s studying the way that Hive NYC can improve its ability to be an infrastructure for innovation, knowing how each member organization interfaces with the Hive becomes really important because it gives us insight into a range of related questions. Who’s bringing ideas and technologies into this community? How does organizational interface mediate who participates in the broader Hive NYC community and who doesn’t? How do innovations travel within and across organizations based on the nature of that organization’s interface? How does an organization’s knowledge and understanding of the Hive NYC community and its ethos, values and educational approaches change over time depending on how it interfaces with network activities? All of these questions are consequential to the broader goal of supporting Hive as a context for educational innovation, and so we’re paying close attention to these issues in the ground.

One of the questions we’ve asked some older Hive NYC members is if there are things they’d recommend to new Hive member organizations. One member recently spoke directly to this point of organizational interface, saying that he felt it was critical that an organization find a Hive point person (or people) who is both really interested in the network and the ideas that are associated with it and at the same time has some degree of power to capitalize on that participation and the opportunities that stem from it in a way that benefits the broader organization. Adding to that point, another member recently mentioned that while she’s the active liaison now, that’s a role that someone else (originally from their development department) used to occupy, and it gradually shifted as it became clearer to the organization that Hive NYC was not just another funding opportunity but rather largely about educational practice, and that from that perspective having a programmatic-oriented staff member engaging made good sense.

There’s plenty more than we’re finding about this issue, but I thought I’d take the opportunity to open this question up for any Hive members that might be reading (folks from other Hives aside from NYC are welcome!). How does your organization “interface” with the Hive? Are there recommendations you have for other orgs about what’s worked for you, or what hasn’t? And what are the things you consider most as you’re making these sorts of decisions?

Announcing Hive Research Lab, an applied research partner of the Hive NYC Learning Network

It gives us great pleasure to announce the launch of Hive Research Lab! As an applied research partner of the Hive NYC Learning Network and collaboration between Indiana University and New York University, our mandate is to strengthen the network through generating data-driven insights, engaging in collaborative work with network members, and bringing in the best ideas from the research literature.

The lab has a great team led by Rafi Santo and Dixie Ching, both former Hive NYC network members, along with Dr. Kylie Peppler and Dr. Chris Hoadley.

For readers that aren’t familiar with the Hive NYC, it’s a city-wide community of 56 after school institutions including museums, libraries, colleges and community-based organizations that collaborate on creating innovative learning experiences for youth. The network emerged from early work to bring theory into practice in the field of Digital Media and Learning, and aims to embody principles of Connected Learning in its work with young people – focusing on production-centered pedagogies, fueled by youth interests, and powered through peer learning and collaboration.

Hive Research Lab will be conducting research that helps Hive NYC achieve collectively articulated goals, but we won’t just be sitting on the sidelines as we do that. We’ll be working with Hive member organizations as well as the network stakeholders at the Mozilla Foundation (Hive “HQ”)  and the Hive Digital Media Learning Fund at the New York Community Trust to think about how we can make a better network both for New York City kids and the out-of-school organizations that make up the NYC informal learning landscape. Our work will mainly center around how to better support Hive NYC youth trajectories and pathways and how networks can provide a robust context for development and spread of learning innovations. What that looks like on the ground is a lot of knocking on Hive NYC member doors, observations of youth programs in action, interviews with Hive NYC members and youth, facilitating design processes with network members, and just generally doing work to understand all the activity that takes place in the Hive.

We created a project blog because we’re committed to being transparent about what we’re doing, and to being relevant on the ground to Hive NYC. Typically, academic journal article publications just happen too slowly to give real-time, usable information for the context under study. Information shared with Hive NYC members two years after something happens might be interesting, but likely won’t be able to affect decisions that they’re making now. So, we want to use this space to share emergent findings, post about relevant research and projects we’re paying attention to, and open up discussions around what we’re seeing on the ground as we do our research. We hope that this sort of tighter feedback loop between research and practice can really help make a difference as the Hive NYC grapples with how it wants to move itself forward.

Watch this space in the coming weeks and months to hear more about the studies that are at the core of HRL, the questions we’re thinking about as we get the lab off the ground, and what we’re starting to see as we get a ‘baseline’ sense of network activity this summer. And don’t hesitate to be in touch if you want to learn more!